Show Me the Number: Communicating Probabilities and Tradeoffs in Real Estate Transactions
Ann M. Mirabito, PhD, Jesse R. Catlin, PhD, and Elizabeth Gelfand Miller, PhD
Real estate professionals frequently advise homebuyers and sellers on the financial aspects of buying a home. These can be complex. Consider just a few decisions a buyer or seller might be called upon to make:
- Timing the market. Your buyer is unsure of whether to buy now or to wait. A quick buy will lock in low mortgage rates but might require a higher purchase price than a protracted negotiation. The question is important: A 1% increase in mortgage rates on a 30-year note effectively wipes out the monthly payment savings from a 10% drop in prices.
- Staging for sale. Your seller is weighing the cost of improving her home today against the possibility of a higher sale price and a faster sale.
- Price it right. Your seller is torn between the allure of setting a high sales price and the practicality of pricing aggressively to promote a quick sale.

Have you ever watched your clients make bad decisions that cost them tens of thousands of dollars, even though you did your best to steer them to better decisions? Why is it sometimes so hard to get clients to understand the financial information you are giving them?
Clients are hampered in part by inexperience. Most people buy only a few homes during their lifetime, and so they approach each transaction as relative novices, unsure of what to consider as they make decisions. And yet the stakes are high. Real estate investments are often an important part of a family's financial portfolio. The emotional stakes are also substantial. A new home offers the promise of an exciting new venture, while sellers are selling not just a home, but deep memories.
The uncertainties inherent in real estate transactions present an even bigger obstacle to decision-making. Clients are making important decisions with incomplete information. Absent a crystal ball, no one really knows: Will the market improve or soften? When? By how much?
In high-stakes, uncertain transactions, clients often look to their real estate professional for guidance. As a real estate professional, you may have access to trends and other historical information that may help your client make a wise decision. But many smart, capable people - your clients included - find statistical information confusing (Schapira, Nattinger, and McHorney 2001); they hear, but they do not understand. And so clients may make suboptimal decisions. You shake your head and go on, knowing that they are probably leaving a lot of money on the table.
Persistent and predictable biases in the ways our brains are wired can make it hard for people to process information dealing with probabilities and uncertainties. For example, in our research, we found that only a small fraction of college-educated people were able to correctly make the trade-off between the risk of rising interest rates and the potential for lower home prices. Our research explores ways of presenting statistical information so that it is easy to comprehend. You cannot eliminate uncertainty for your clients, but there are ways you can package the facts to help your clients make better decisions.
Can Numbers Be Helpful?
Our research explores the benefits of conveying information with numbers and with graphs. Specifically, which format helps people make better decisions? We use experiments to help us answer this question. In a typical study, we describe a real world problem that requires interpreting complex data to make good decisions. Some of our research participants see a graphic display of the data, others see numeric, and others see a combination (for example, they might see numeric risk incidence but graphic base rates). All of our research participants answer the same questions. We then compare answers to determine the relative power of the numeric presentations compared to the graphic presentations.
We have found that simply stated, numeric information tends to be more informative. We start by recognizing that there are two kinds of knowledge that are important to decision-making: verbatim knowledge (in other words, being able to recognize important information) and gist knowledge (in other words, understanding the key points). We have found that numeric presentation formats tend to improve verbatim knowledge of the problem. People with better verbatim knowledge are more likely to grasp the gist message. Decisions, in turn, are influenced mainly by people's understanding of the gist of the information (Catlin, Miller, and Mirabito 2013).
Formatting the Numbers
If you're a "numbers person," you may favor presenting your clients with numeric information. But an individual's ability to evaluate numeric information depends on his education, knowledge about the topic, and general fluency with numbers. A few guidelines may help you make your numeric presentations more accessible to your clients.
- Simplify the fractions. Imagine that, after culling through your office's records, you discovered that out of the 570 homebuyers your team has worked with this year, 513 stated that a particular feature in a home is important. Another team may have determined that 399 of their 456 buyers request a different feature. That information can be invaluable to a seller readying his home for the market. You could tell your seller that 513/570 favor one feature and 399/456 seek the other feature, but complex ratios like these are intimidating to most people. If you have a calculator handy, you'll see that 513/570 is equal to .9 (90%) and 399/456 is equal to 7/8 (87.5%).
Researchers have found that people make better decisions when the information is presented more simply. Even when people are paid a fair amount of money to evaluate fractions accurately, most people are more confused by complex fractions (for example, 399/456) than by easier equivalents (7/8) (Johnson, Payne, and Bettman 1988). Take the extra step to simplify the fractions. However, also inform clients the number of people (e.g. 570; the base rate) the information is based on because statistics from a larger sample are likely to be more reliable than those from a smaller sample.
- Choose common denominators. Your clients are likely to be stumped if they learn that, in the last 30 days, "2-in-7" houses sold in Neighborhood A whereas "5-in-35" houses sold in Neighborhood B. The comparison becomes clear when common denominators are used. It's easy to see the advantages of Neighborhood A when the information is presented as "10-in-35" for Neighborhood A compared to "5-in-35" houses sold in Neighborhood B (Ancker et al. 2006).
Relative Risk and Absolute Risk
In the mid-1990s, British women were alarmed by the results of a new study into the risks of taking the then-popular birth control pill containing desogestrel and gestodene. British newspapers reported that women taking the third generation pill faced a 100% increase in the risk of thromboembolism, a condition that involves clotting in the arteries that can lead to fatal strokes. Not surprisingly, many women stopped taking the pill in response to the media reports. Women who had more information about the study, however, might have made a different decision.
Indeed, the study found that for every 14,000 women who did not take the pill, one would suffer from thromboembolism, whereas for every 14,000 women who did take the pill, two would contract thromboembolism. In other words, women who did not take the pill faced a .007% chance of disease while those who took the pill faced a .014% chance of disease. Yes, the relative increase in risk was 100%. But the absolute increase risk was just .007%. The consequences of the incomplete information were grim. Unwanted pregnancies soared and an estimated 10,000 British women had abortions as a result of the news (Kurz-Milcke, Gigerenzer, and Martignon 2008).
People need information about both the risk incidence (e.g., two women who took the pill) and the base rate (e.g., 14,000 women) to make informed decisions. Generally, people who are given only the relative risk information (in this case, the 100% increase in blood clots) are more likely to be alarmed than people who look at the absolute risk change (in this case, .007%). In our research, we have found that most people do not realize that base rate information is missing. You can help your clients make better decisions by arming them with both the relative risk and the absolute risk.
Draw a Picture
Rare events, or "long shots," are particularly hard for people to grasp. Sometimes people overweight the likelihood that a long shot will come true. Powerball players, for example, frequently overestimate the odds of holding a winning ticket (Kahneman and Tversky 1979). Other times, small chances are mentally written off as "no chance."
Similarly, complex information, such as percents of percents, can be difficult to understand. So how can you make a rare event or a complex event understandable to a client? Graphs are frequently easier to grasp and are more memorable than numeric presentations (Ancker et al. 2006). Graphical formats include bar graphs, stacked bar graphs (which use two bars on top of each other to depict both the numerator and denominator of the risk probability), pie charts, line graphs, icon arrays (which we discuss below) among others. Of these, bar graphs are often liked better by individuals due to their simplicity and clarity (Fortin et al. 2001). It's not clear which of these formats is most effective, although bar graphs and icon arrays generally outperform other formats.
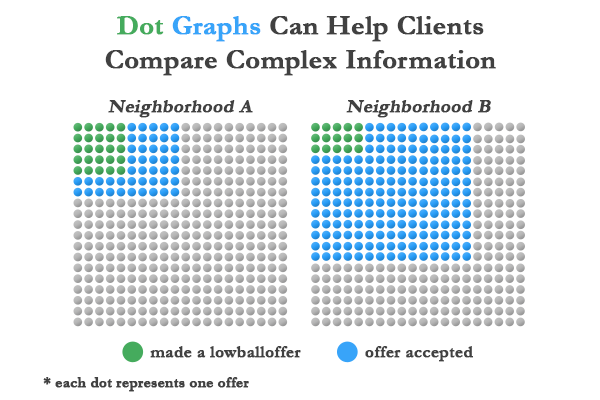
Dot graphs, also known as icon arrays, can help people understand rare or complex events. A client may be considering making aggressive offers for multiple properties in two neighborhoods. From your research, you may know that 17.5% of the offers in Neighborhood A are "lowball" offers, and of those, 35.7% are accepted. For Neighborhood B, 49% of the offers are "lowball" offers and 7.7% are accepted. In which neighborhood are sellers more likely to accept your client's aggressive offers? People often have trouble reasoning through percentages or proportions like these. A better solution may be to present the data visually. In a dot array graph, the offer information is presented as individual icons, such as dots, houses, or stick figures, as shown in Figure 1. Research shows that this type of presentation helps people focus on the core information, rather than extraneous details (Ancker et al. 2006).
Graphs are also better than tables for showing trends in data. Stone et al. (2003) found that for numerator (incidence) and denominator (base rate) relationships, when one is presented graphically and the other is provided in numbers, the graphically represented information tends to be more salient and therefore has a greater influence on behavioral intentions.
Illuminating Clients' Decision-Making
Real estate decisions are inherently risky in that clients are uncertain of the magnitude and direction of financial returns. Buyers and sellers are frequently confronted with complex statistical information as they seek to manage that risk. Real estate professionals can help clients make wise decisions by presenting the information in a way that maximizes the chances that the client will understand it. Both numeric and graphic presentations can be helpful; the key is to present the information plainly.
. . . . . . . . . . . . . . . . . . .
References
Ancker, Jessica S., Yalini Senathirajah, Rita Kukafka, and Justin B. Starren (2006), "Design Features of Graphs in Health Risk Communication: A Systematic Review," Journal of the American Medical Informatics Association, 13(6), 608-18.
Catlin, Jesse R., Elizabeth Gelfand Miller, and Ann M. Mirabito (2013), "The Effect of Health Risk Presentation Format on Consumer Perceptions and Choice," in The Changing Role of Policy in Consumer Well-Being: AMA Marketing & Public Policy Academic Conference Proceedings Linda Salisbury and Kathleen Seiders, eds.: American Marketing Association, in press.
Fortin, Jennifer M., Linda K. Hirota, Barbara E. Bond, Annette M. O'Connor, and Nananda F. Col (2001), "Identifying Patient Preferences for Communicating Risk Estimates: A Descriptive Pilot Study," BMC Medical Informatics and Decision Making, 1(2).
Johnson, Eric C., John W. Payne, and James R. Bettman (1988), "Information Displays and Preference Reversals," Organizational Behavior and Human Decision Processes, 42(1), 1-21.
Kahneman, Daniel and Amos Tversky (1979), "Prospect Theory: An Analysis of Decision Under Risk," Econometrica, 47(2), 263-91.
Kurz-Milcke, Elke, Gerd Gigerenzer, and Laura Martignon (2008), "Transparency in Risk Communication," Annals of the New York Academy of Sciences, 1128, 18-28.
Schapira, Marilyn M., Ann B. Nattinger, and Colleen A. McHorney (2001), "Frequency or Probability? A Qualitative Study of Risk Communication Formats Used in Health Care," Medical Decision Making, 21(6), 459-67.
Stone, Eric R., Winston R. Sieck, Benita E. Bull, J. Frank Yates, Stephanie C. Parks, and Carolyn J Rush (2003), "Foreground: Background Salience: Explaining the Effects of Graphical Displays on Risk Avoidance," Organizational Behavior and Human Decision Processes, 90(1), 19-36.
. . . . . . . . . . . . . . . . . . .
About the Authors
Ann M. Mirabito, PhD
Assistant Professor of Marketing
Hankamer School of Business, Baylor University
Ann M. Mirabito is Assistant Professor of Marketing in the Hankamer School of Business at Baylor University. Ann's research focuses on how consumers make complex decisions related to value (quality evaluations, price fairness, risk management) and the role of biases and heuristics in those decisions. Her service marketing research is in the context of health care, where she has explored ways stakeholders can act to improve outcomes and value. Her work has appeared in Harvard Business Review, MIT Sloan Management Review, Journal of Business Research, and Journal of Public Policy and Marketing as well as in medical journals including Annals of Internal Medicine and Mayo Clinic Proceedings, and she has been interviewed by Voice of America and National Public Radio. In 2008, she was named the Rachel Hunter Moore Outstanding Woman Faculty Member at Baylor University. Ann holds a PhD from Texas A&M University, MBA from Stanford University, and BA in Economics from Duke University. She has 15 years executive responsibility in large (Frito-Lay, Time Warner) and small organizations; in consumer and B2B; and nonprofit (Chamber of Commerce) and government (Federal Reserve Board).
Jesse R. Catlin
Assistant Professor of Marketing
Washington State University Tri-Cities
Jesse R. Catlin is Assistant Professor of Marketing at the College of Business at Washington State University Tri-Cities. His general area of research is consumer behavior, with a frequent emphasis on how consumers make tradeoffs and arrive at decisions, especially when faced with complicated information and/or uncertainty. Substantively, his research often focuses on issues related to sustainability and health. Jesse's work has appeared in the Journal of Consumer Psychology, Journal of Public Policy & Marketing, Journal of Business Research, Health Communication, among other outlets. Jesse holds a PhD from the University of California, Irvine as well as BA and MA degrees in Economics from California State University, Sacramento. Prior to his academic career, Jesse worked as an economic and market research consultant.
Elizabeth Gelfand Miller, PhD
Associate Professor of Marketing
Isenberg School of Management
University of Massachusetts Amherst
Elizabeth G. Miller is Associate Professor of Marketing at the Isenberg School at the University of Massachusetts Amherst. Her research focuses on understanding how emotions (especially stress) influence how consumers process information, as well as how the way information is presented changes whether consumers use it. She frequently studies these issues within the context of consumers' health-related decisions, examining ways to reduce stress during negative service events and strategies for improving consumers' food choices. Her work has appeared in the Journal of Consumer Research, Journal of Marketing Research, Journal of Public Policy & Marketing, Journal of Service Research, and the Journal of Business Research, among other places. Elizabeth holds a PhD and MA from the Wharton School at the University of Pennsylvania and a BA in Psychology and Chemistry from Cornell University.