Lead Generation: What Really Works?
By Chris Pullig, PhD, Laura Indergard, MBA, Suzanne Blake, MBA Candidate, and Jacqueline Simpson, MBA Candidate
A Survey of Real Estate Professionals
As a way of beginning to understand what really works in the area of lead generation, a survey was created and conducted with a large group of real estate professionals from across North America. The survey was conducted entirely online. Over 50,000 real estate professionals were emailed a link to the survey with a request to respond to a series of questions that ranged from their spending in areas designed to create leads to perceptions of the local real estate market conditions. Responses have been kept entirely anonymous. After eliminating surveys due to incomplete records (missing data) we have 1176 usable responses. The sample is representative of a large-scale study in that the population of the markets served by the respondents varies from 50,000 or less (8% of the sample) to 500,000 or greater (40% of the sample). Twenty-four percent (24%) of the respondents have been in the real estate industry less than two years. Fifty-four percent(54%) have been in real estate between two and ten years and 22% have been in the industry at least ten years with 9% reporting over 20 years of experience. Seventy-one percent (71%) of the survey participants indicated that they had some type of Professional Designation (ABR, GRI, etc.).
Overview of the Survey
In the survey we focus on the lead generation process as a three-step process: 1) lead generation, 2) conversion of the lead to an appointment, and 3) closure of the appointment to a transaction (listing or sale). Lead generation, the first step, is defined as identification of potential customers. Identification of potential customers is most often accomplished through direct contact (i.e., face-to-face, telephone, Internet, etc.). This may be the result of marketing efforts such as print advertising or other means such as individual consumers seeing a yard sign and contacting the agent. Identification of potential customers could also be accomplished through other means such as a referral, acquisition of a list of customers, or other more proactive means. Conversion of the lead to an appointment, the second step, would mean moving from identification to establish a meeting for the purposes of consultation on the potential of conducting a transaction. It is possible that this could occur simultaneously with the initial contact. Closure of the appointment to a transaction, the final step, we define as follows. When dealing with a seller we define the transaction as a listing. When dealing with a buyer we define the transaction as a sold property. Prior to beginning the survey respondents were asked to gather detailed information on each of these three activities and to set aside roughly 15 minutes to complete the survey. Acknowledging that respondents might not have exact data on all issues of interest, we asked them to simply estimate when needed. To allow us to separate those respondents who estimated from those with accurate records we included a measure of whether the respondent kept records on lead generation activity and then how detailed these records are for each of the three areas listed above.
Survey Results: Defining Characteristics of the Respondents
In this section we address several very basic questions. We first approach the nature of the market for the respondents. In addition to reporting this information here we use this information later in our analysis. The next set of questions focuses on the extent to which records are kept in the area of lead generation. We also look at how much effort or spending is placed in various lead generation activities and at the success rates from these efforts in terms of leads generated and conversion of leads to appointments and closed transactions. In addition, we asked about the nature of the lead generation effort as being more of a "seek" or prospecting strategy (i.e., calling prospects) versus an "attract" or marketing strategy (i.e., advertise and wait for the phone to ring). We also evaluated the average time elapsed before responding to a lead and the strategy in dealing with excessive lead loads.
So, how is business?
The challenges of the real estate local market are great with 63% of the sample reporting their local market as having an increasing real estate inventory. Twenty-three percent (23%) report the inventory as remaining level and 14% report that their local real estate inventory is decreasing. But, the group of respondents remain upbeat as 68% report that their local market is in their opinion "Somewhat Better, Better, or Much Better" than the national average. Fourteen percent (14%) report their local market is about the same while 18% report it is "Somewhat Worse, Worse, or Much Worse". In a similar vein, 63% of respondents report that they are doing better than average in the local market, 18% report that they are doing about the same as everyone else, and 19% report they are doing somewhat worse, worse, or much worse than their peers. When asked about the relationship of the average selling price relative to the average listing price respondents indicated that this figure ran on average 89.6%. That is, a property listed sells on average at 10.4% below the listing price. This ratio did not significantly vary across market conditions.1
To what extent do individual agents keep records of lead generation activity and how detailed is this information?
Respondents were asked the extent to which they kept detailed records in their lead generation efforts. Seventy percent (70%) of respondents report that they keep lead generation records, 53% keep records on conversion of leads to appointments, and 66% keep records on conversion of appointment to close. Using a 5-point scaled item we asked how detailed these records are (1=Not Detailed at All, 2=Not Very Detailed, 3=Neutral, 4=Moderately Detailed, and 5=Extremely Detailed). In terms of Lead Generation and Conversion to Appointment, only 23% of the respondents report their records as at least Moderately Detailed or Extremely Detailed. Detail in the records for Closure to a Transaction is somewhat better with 32% of respondents reporting their records as at least Moderately Detailed or Extremely Detailed.
Where do agents place their effort or spending in creating leads?
Through a review of previous lead generation articles in marketing in general and also specifically the real estate industry we identified 18 different sources of leads. Respondents were asked to allocate the level of effort or spending in these areas as a percentage of their total spending. Using the same method as described above, respondents were asked about the level of detail in their spending records. Spending records are on average more detailed with 60% of respondents keeping at least Moderately Detailed records. Only the respondents who reported confidence in the detail of their records are used in the analysis. The allocations for the top nine lead generation areas are reported below.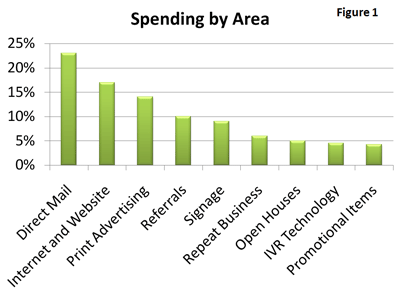
As can be seen in Figure 1, on average respondents allocate spending to Direct Mail more than any other area (23% of total spending) with 17% allocated to Internet and Website activities, 14% to Print Advertising, 10% to acquiring Referrals, 9% on Signage. Roughly 6% of spending is to ensure Repeat Business followed by 5% on Open Houses, 4.5% on Interactive Voice Response (IVR) Technology, and 4.2% on Promotional Items.
More about the leads and how they are handled.
Respondents report the leads they generate are slightly more for buyers (58%) than sellers (42%). They report that the conversion rates average 50% for leads converted to appointments and 48% for appointments converted to a transaction. On average, respondents are fairly balanced in their lead generation strategy focus. When asked to allocate between two basic strategies what percentage of their efforts are "attract" focused versus "seek" focused, respondents allocate on average 49% to seek and 48% to attract. In terms of how long most respondents take to follow up with a lead, 64% reported that they normally would do so within 4 hours and 87% within 8 hours. A substantial number indicated it might be the next day or longer. Only 39% reported that they did not ever face a situation where lead generation outpaced the ability to follow up promptly. When asked about how excess lead volume is handled the remaining 61% reported that they most likely would either "Refer" the customer to another agent (64%) or they would "Cherry Pick" or work the most recent leads first (57%).
More Analysis: What the Data Says Really Works
In this section we address questions related to what lead generation activities and strategies work best. We examine this basic question for the entire sample as well as taking into consideration self-report success in the local market and local market conditions.
What lead generation activities are most productive in generating leads?
Respondents were also asked to allocate 100 percentage points to the 18 lead generation activities in terms of which ones created the most leads. To assess which of the areas is most productive, a metric we have labeled the productivity index (PI) was created. This was done by simply dividing the lead generation allocation by the spending allocation. That is, if the respondent attributed, for example, 20% of their leads as a result of print advertising this was used in the numerator and the allocation for spending in print advertising, for example 15%, in the denominator. Using the numbers given here would return a value 1.33 (20%/15% = 1.33). Assuming all leads from all sources are of equal value this provides a measure of lead generation productivity. A value in excess of 1 would reflect a more productive activity than one with a value of less than 1. Using the computed values, we tested this to see if each of the lead generation activities were significantly different from a value of 1. If the productivity index (PI) is significantly less than 1 then the activity is seen as less productive than the spending put into the activity. If the productivity index (PI) is significantly greater than 1 then the activity is more productive relative to the investment.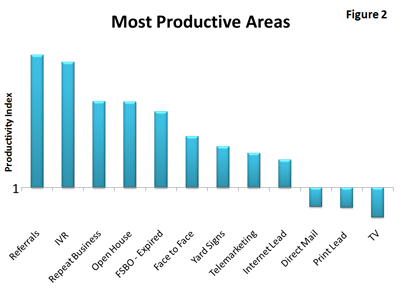
In Figure 2, you will see that nine lead generation activities that are rated as significantly productive (PI > 1). Activities related to Referrals as a source of leads, IVR Technology, Repeat Business, Open Houses, FSBO Expired leads, Face-to-Face/Networking, Yard Signs, Telemarketing, and Internet/Website are all seen as productive relative to the spending in these areas. For the most part, these activities are not as cost intensive. In Figure 2 you will also see that three activities are rated as less than productive (PI < 1). Television, Print Advertising, and Direct Mail are all rated as significantly less productive relative to the spending in these areas. These activities are in most cases all more cost intensive. Thus, investment in these areas is to be chosen wisely.
What do those who report doing better than their local market do differently?
Is there a difference in lead generation activities for those individuals who self-report doing better than the local market? For starters, those who say they are doing better than average also report significantly higher lead conversion rates to appointments (51% vs. 42%) and higher conversion rates from appointments to a transaction (52% vs. 41%) when compared to those who say they are not doing as well. It is difficult to say what the cause of this might be. It may be the way they generate their leads or it may be that they simply do a better job with the leads once they have them. In terms of spending on lead generation activities, those who report they are having success also report pertaining to observations that are unlikely to occur by chance and therefore indicate a systematic cause" significantly lower levels of spending on Open Houses (5% vs. 8% of total spending) and Promotional Items (3.8% vs. 6.2% of total spending). Interestingly, these individuals also report that Open Houses are more productive in generating leads. This is likely due to a more focused approach in use of this lead generation method. Two additional differences stand out as well. Those who report greater success on average respond to initial leads more quickly. They are also more "seek" oriented in their lead generation strategy. They report that they use more "seek-like" strategies, more prospecting proactive strategies, than they do "attract" or marketing-only oriented strategies - 55% "seek" vs. 45% "attract". Respondents who report not doing as well report a 44% "seek" and 56% "attract" strategy orientation.
What's the effect of faster versus slower follow-up on lead conversion?
Does faster follow-up mean higher lead conversion rates? This is likely the case. In the Three-Stage Model article reviewed in the Research Insider - Marketing Mix article faster follow-up to initial lead inquiries resulted in higher conversion rates. But, that research was conducted in a different industry with different norms for follow-up delays.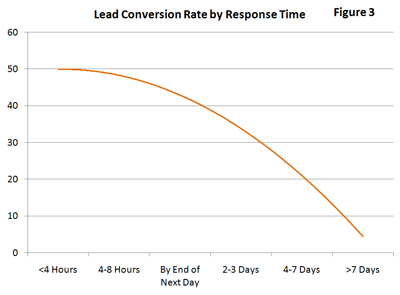 We examined the relationship between time to follow-up and conversion rates within this study. We found that the relationship was more complex and nonlinear than we had expected. As you can see in Figure 3, there is no real difference between a response that occurs within 4 hours and one that occurs between 4-8 hours. But, there is a decline in conversion rates once the response is greater than 8 hours. Thus, there is a critical point at which the follow-up begins to lose its effectiveness. A follow-up within 8 hours is best. A follow-up by the end of the next day is less effective in converting leads to appointments and transactions. And, waiting later than this creates a significant drop in conversion rates. Is there a difference in a "seek" versus an "attract" orientation in creating more convertible leads?
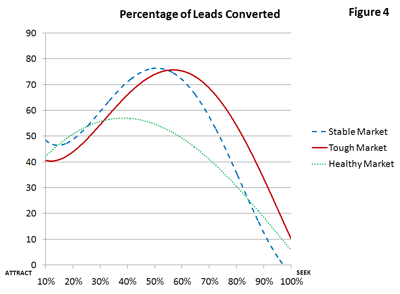 We also examined the relationship between lead generation orientation and lead conversion rates. Again, the relationship it is again not a perfectly linear one and it depends on the nature of the market.2 These results are illustrated in Figure 4. When the market is relatively "stable," a balanced approach appears appropriate in delivering lead conversion. That is, an approach that is about 50% "seek" and 50% "attract" results in the greatest percentage of leads being converted to an appointment and a transaction. When the market is "tough," it appears that the best strategy is one where the shift is more towards a "seek" orientation, a more aggressive prospecting strategy. The ratio appears to be best at about a 60/40 seek orientated strategy. When the market is "healthy," a strategy that is more "attract" oriented is desired. Marketing your properties in a more traditional way (i.e., advertising) with less focus on seek strategies may be more appropriate when the market is more healthy.
Finally, what is that those individuals doing well in a "tough" market do differently?
As expected, these individuals report significantly higher conversion rates to appointments (54% vs. 43%) and closure to a transaction (52% vs. 42%). They also spend significantly more on their Internet/Website lead generation activities (18% vs. 12%) and IVR Technology (3% vs. 0.5%). These individuals also report significantly less spending in Signage (9% vs. 12%) and Open House activities (5% vs. 9%) when compared to those who are not doing as well. And, these individuals report that they are more "seek" oriented than their peers.
Conclusions.
So how do you use this information? It is useful as a benchmark for average spending in lead generation activities, conversion rates, lead generation orientation (seek vs. attract), time elapsed to follow up on leads, and how to handle excess lead volume. The results of the study also give insights into what others report as most productive in generating leads and the areas in which some of the better performing agents are focusing their efforts. The results also illustrate the impact of delay in responding to leads once generated and the effectiveness of your lead generation orientation.
Key Findings:
Lead Generation Spending On Average (for those with good records in spending)
- Direct Mail (23%)
- Internet/Website (17%)
- Print Advertising (14%)
- Referrals (10%)
- Signage (9%)
- Repeat Business (6%)
- Open Houses (5%)
- Interactive Voice Response (IVR) Technology (4.5%)
- Promotional Items (4.2%)
More Productive Lead Generation Activities
- Referrals
- IVR Technology
- Repeat Business
- Open Houses
- FSBO Expired Leads
- Face-to-Face/Networking
- Signage
- Telemarketing
- Internet/Website
Less Productive Lead Generation Activities
- Television Advertising
- Print Advertising
- Direct Mail
Characteristics of More Successful Agents
- Higher lead and appointment conversion rates
- Less spending on Open Houses as a percentage of their total spending
- Less spending on Promotional Items as a percentage of their total spending
- More productive use of Open Houses
- More "seek" oriented in their lead generation activities
Characteristics of More Successful Agents in "Tough" Markets
- Higher lead and appointment conversion rates
- Greater spending on Internet/Website as a percentage of their total spending
- Greater spending on IVR Technology as a percentage of their total spending
- Less spending on Signage as a percentage of their total spending
- Less spending on Open Houses as a percentage of their total spending
- More "seek" oriented in their lead generation activities
Lead Follow-up Must Occur Within 8 Hours to Ensure Higher Conversion Rates
"Seek" versus "Attract" Lead Generation Orientation
- More "seek" oriented (60/40) for highest lead conversion in a "tough" market
- Balanced orientation (50/50) for highest lead conversion in a "stable" market
- More "attract" oriented (40/60 - seek/attract) for highest lead conversion in a "healthy" market
. . . . . . . . . . . . . . . . . . .
CAVEAT:
As with any research there are limitations. Specifically, any survey research results should be considered in the context of your own business and local market conditions. That is, there may be specific characteristics of your business model and the local market that are not captured in the survey that would affect your own individual results. We do hope you find this research helpful in that it gives you issues to think about as you devise your lead generation strategies going forward. Obviously, the best method of creating an effective lead generation program is to track your own efforts in each lead generation area and the number and quality of the leads each area generates. Then you will be in a position to track your performance and adjust to maximize your lead generation efficiency for your business and the local market conditions. If you have any questions or comments regarding this research please feel free to use the feedback option at the top of the webpage where you found this article.
. . . . . . . . . . . . . . . . . . .
Footnotes
1 Using two indicators we formed a composite measure of local market conditions. We used the 3-point scaled item - whether respondents thought their inventory was increasing, staying the same, or decreasing - and the 5-point scaled item asking respondents their perception of the local market as better or worse. The two measures were standardized due to the scale length differences and a summated scale was formed. Then a three-group variable was formed such that we have one group of respondents in a "tough" market, one group in a "stable" market, and one group in a "healthy" market. This variable is used in subsequent analysis. 2 For the non-linear relationships a regression is run with linear, quadratic, and cubic curve fit estimations. For the regression model using "time to respond" as the independent variable the model that fits best is a quadratic regression. For the regression using "seek vs. attract" as the independent variable the cubic curve fit model is the best fitting model. For both of these regression models the model and individual coefficients are all statistically significant (all p-values < .05). Additional information on any of the statistical analysis is available upon request.
. . . . . . . . . . . . . . . . . . .
About the Authors:
Chris Pullig, PhD, Associate Professor of Marketing, Baylor University
Director of the Keller Center for Research and Keller Center for Professional Selling
Before beginning his academic career, Professor Pullig worked in the retail industry as the CEO of a chain of specialty clothing stores and also as a consultant with the Small Business Administration. He received his PhD from Louisiana State University and was previously on the faculty at the University of Virginia. His research is in consumer attitudes and decision making, with an emphasis on effective creation and protection of consumer-based brand equity. His previous work has been published in the Journal of Marketing, Journal of Academy of Marketing Science, Journal of Retailing, Journal of Consumer Psychology, Journal of Public Policy and Marketing and others.
Laura Indergard, MBA, Baylor University
Associate Director Keller Center for Research and Keller Center for Professional Selling
Editor, Keller Center Research Report
Laura earned an MBA from Baylor University and a BS in Radio-TV-Film production from Texas Christian University. Her background includes work in the advertising industry as a copywriter for IT Network and as an independent small business consultant focusing on marketing and feasibility studies.
Suzanne Blake, MBA Candidate, Dec 2008, Baylor University
Graduate Assistant, Keller Center for Research
Suzanne is a second year graduate student from Tahlequah, OK. She earned her BBA in Entrepreneurial Management from Texas Christian University.
Jacqueline Simpson, MBA Candidate, May 2009, Baylor University
Graduate Assistant, Keller Center for Research
Jacqueline is a first year graduate student from Georgetown, TX. She earned her BBA with a double major in Marketing and International Business from Baylor University.